from a homework
Degree Level: Pre-College
Question:
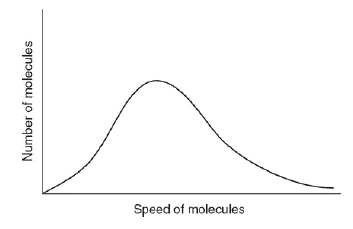
The graph shows the distribution of speeds for one mole of hydrogen at temperature T, pressure P, and volume V. How would the graph change if the sample was changed from one mole hydrogen to one mole of argon at the same temperature, pressure, and volume?

You don`t have permission to comment here!
Report