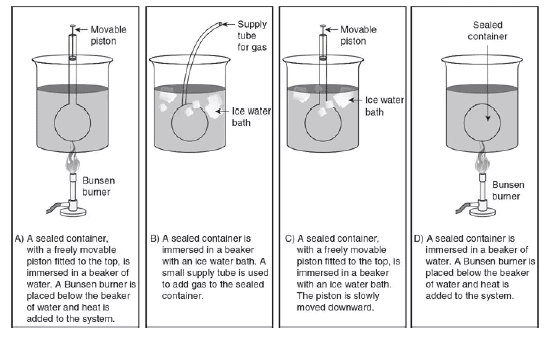
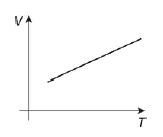
from a homework Degree Level: Pre-College Question: Which of the experimental setups shown in the figure above is most likely to produce the graph shown? Answer: This content is for registered users only. Please login or create an account, it is free!. You don`t have permission to comment here! Report

You don`t have permission to comment here!
Report